Quantum k-medians clustering#
Code at: https://github.com/qiboteam/qibo/tree/master/examples/qclustering
Implementation of QKmedians from the paper: 2301.10780.
Before using install additional package:
h5py
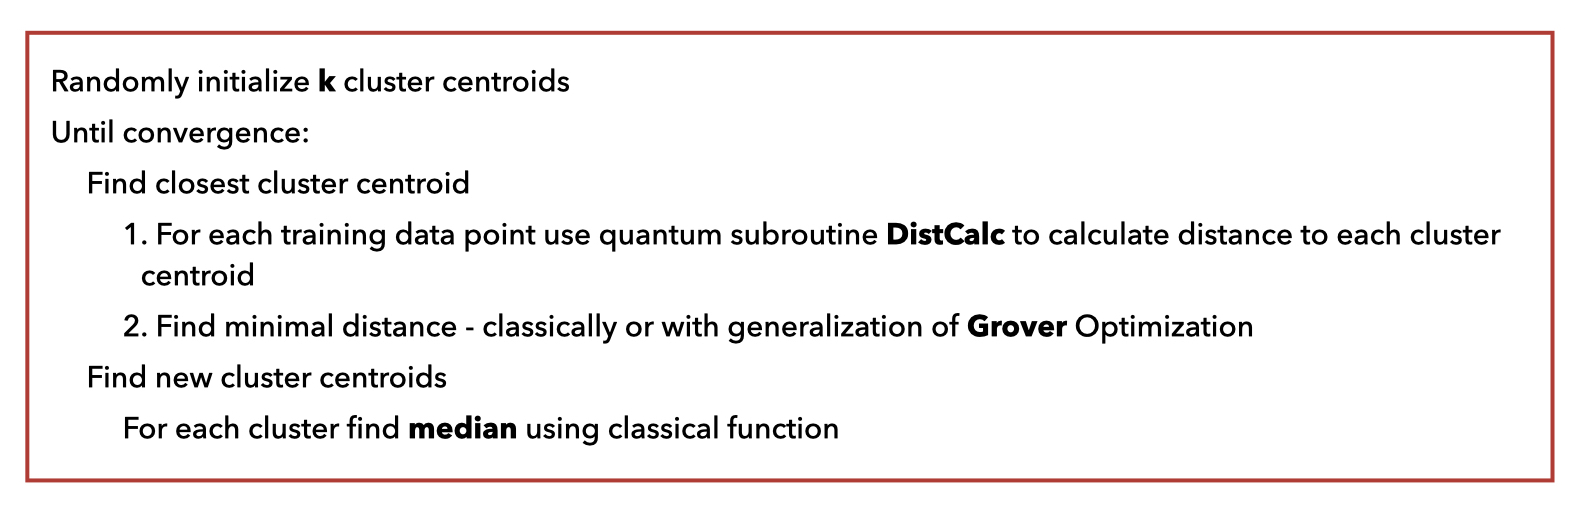
Algorithm’s pseudocode#
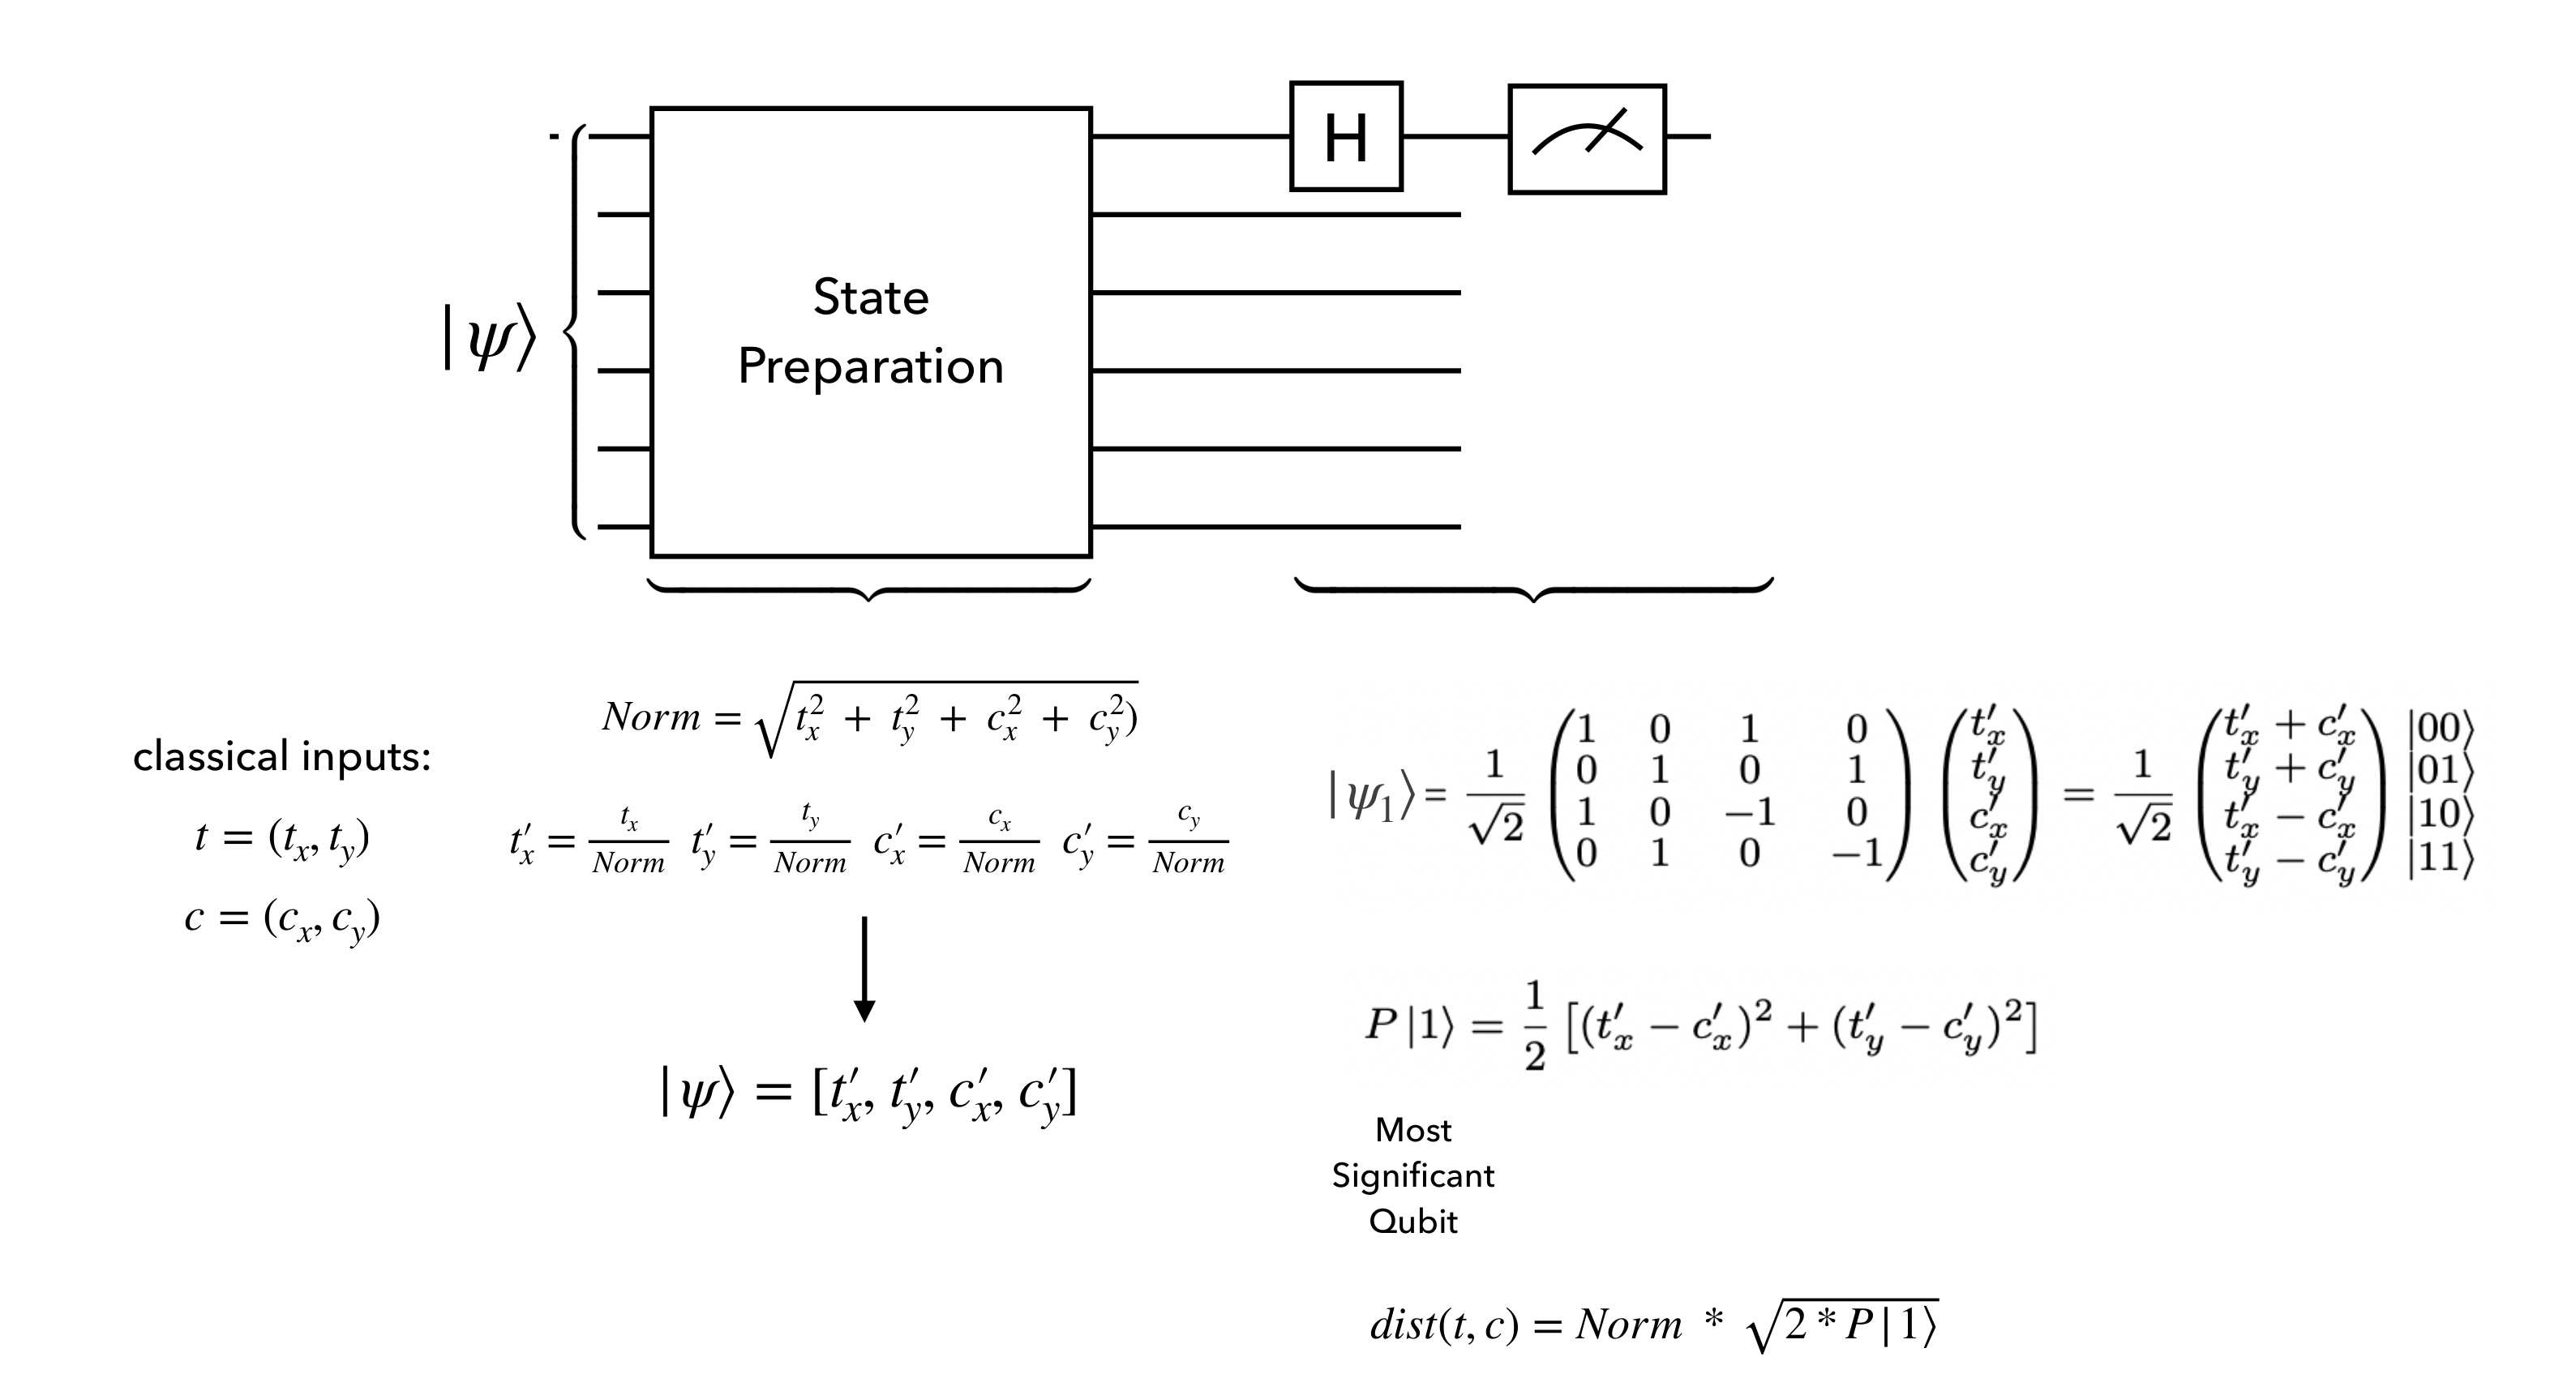
Distance calculation quantum circuit#
How to run an example?#
Scripts are using qibojit as default backend.
Download dataset#
Dataset’s dimensionality is reduced by passing it through autoencoder. If you are interested more, please refer to [*].
Reduced dataset can be downloaded from Zenodo :
record/7673769
Small portion of dataset in data folder:
latentrep_QCD_sig.h5: train dataset (QCD)latentrep_QCD_sig_testclustering.h5: test dataset (QCD)latentrep_RSGraviton_WW_NA_35.h5: test dataset (Signal)
Run training#
To run a training of quantum k-medians algorithm we need to provide arguments:
train_size(int): number of samples for trainingread_file(str): path to the training datasetseed(int): seed for consistent results in trainingk(int): number of clusters (default = 2)tolerance(float): convergence tolerance (default = 1.0e-3)min_type(str): minimization type for distance to cluster search (default = 'classic')nshots(int): number of shots for executing quantum circuit (default = 10000)save_dir(str): path to save resultsverbose (bool): print log messages during the training ifTruenprint (int): print loss function value eachnprintepochs ifverboseisTrue
python train_qkmedians.py --train_size 600 --read_file 'data/latentrep_QCD_sig.h5' --k 2 --seed 123 --tolerance 1e-3 --min_type 'classic' --save_dir 'output_dir' --verbose true --nprint 1
Run evaluation#
To run an evaluation of quantum k-medians algorithm we need to provide arguments:
centroids_file(str): name of the file for saved centroids coordinatesdata_qcd_file(str): name of the file for test QCD datasetdata_signal_file(str): name of the file for test signal datasetk(int): number of clusters (default = 2)test_size(int): number of test samples (default = 10000)title(str): Title of ROC curve plot (default = 'Anomaly detection results')results_dir(str): path to file with saved centroidsdata_dir(str): path to file with test datasetssave_dir_roc(str): path to directory for saving ROC plotxlabel(str): name of x-axis in ROC plotylabel(str): name of y-axis in ROC plot
python evaluate.py --centroids_file 'centroids.npy' --data_qcd_file 'latentrep_QCD_sig_testclustering.h5' --data_signal_file 'latentrep_RSGraviton_WW_NA_35.h5' --results_dir 'output_dir' --data_dir 'data' --save_dir_roc 'output_dir'
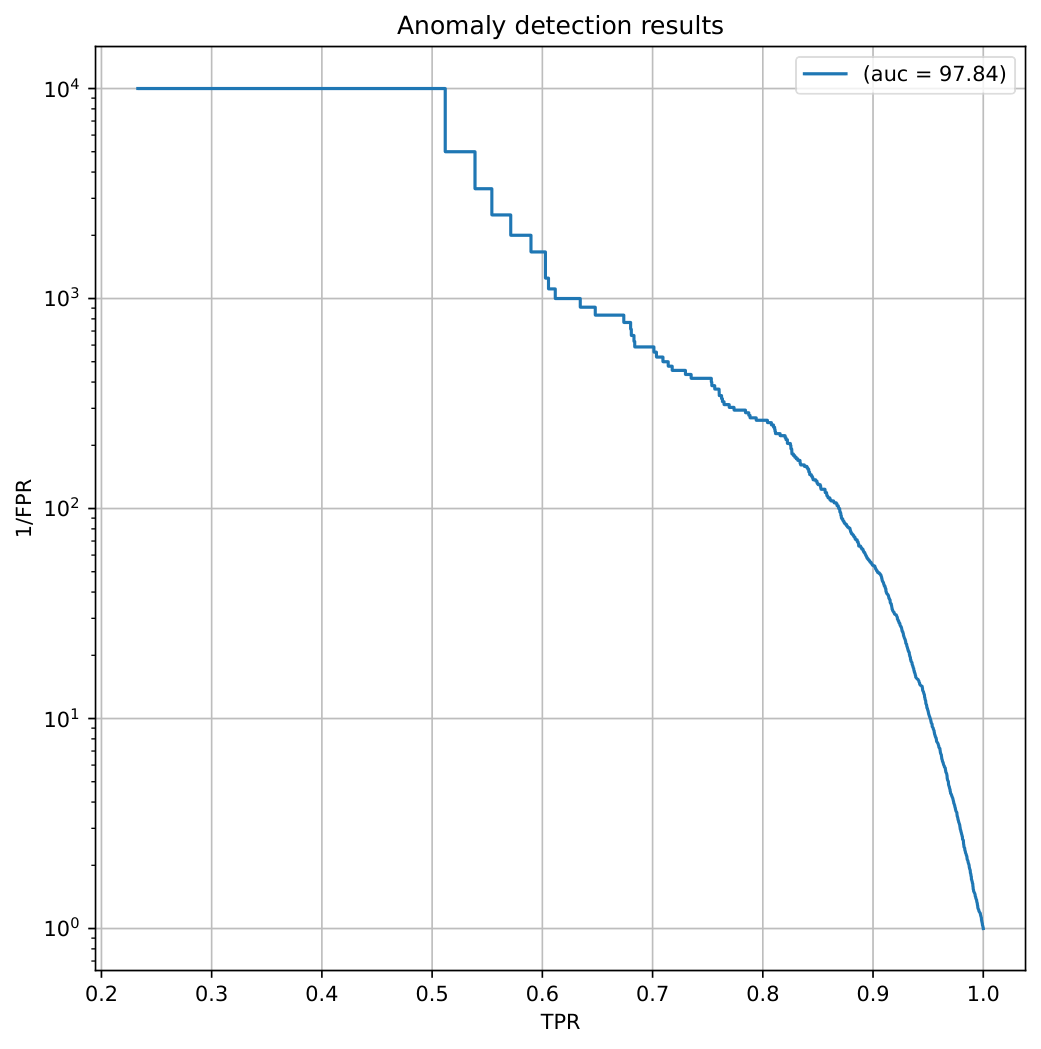
ROC curve plot#
Output of evaluation script