Qubit spectroscopies
In this section we are going to present how to run with qibocal some qubit spectroscopy experiments.
Qubit Spectroscopy
To measure the resonance frequency of the qubit it is possible to perform a qubit spectroscopy experiment. After having obtained an initial guess for the readout amplitude and the readout frequency through a Resonator punchout this experiment aims at extracting the frequency of the qubit.
In this protocol the qubit is probed by sending a drive pulse at variable frequency \(w\) before measuring. When \(w\) is close to the transition frequency \(w_{01}\) some of the population will move to the excited state. If the drive pulse is long enough it will be generated a maximally mixed state with \(\rho \propto I\) [2, 9].
When the frequency bandwidth measured exceeds the IF bandwidth range (+/- 300 MHz), the routine automatically splits the sweep into multiple batches, adjusting the LO frequency accordingly for each batch.
The sweep can be specified directly with frequency or by setting
freq_width and freq_step relative to the configured qubit drive
frequency. The drive pulse amplitude and duration can be set with
drive_amplitude and drive_duration.
“””
Parameters
- class qibocal.protocols.qubit_spectroscopies.qubit_spectroscopy.QubitSpectroscopyParameters(frequency: tuple[float, float, float] | tuple[Literal['linspace'], float, float, int] | tuple[Literal['window'], float, float, float] | tuple[Literal['linwindow'], float, float, int] | tuple[Literal['center'], float, float] | tuple[Literal['lincenter'], float, int] | tuple[Literal['asym'], tuple[float, float], float] | tuple[Literal['linasym'], tuple[float, float], int] | None = None, freq_width: int | None = None, freq_step: int | None = None, drive_duration: int = 4000, drive_amplitude: float = 1.0)[source]
QubitSpectroscopy runcard inputs.
- frequency: tuple[float, float, float] | tuple[Literal['linspace'], float, float, int] | tuple[Literal['window'], float, float, float] | tuple[Literal['linwindow'], float, float, int] | tuple[Literal['center'], float, float] | tuple[Literal['lincenter'], float, int] | tuple[Literal['asym'], tuple[float, float], float] | tuple[Literal['linasym'], tuple[float, float], int] | None = None
Drive frequency [Hz] range for sweep.
- drive_duration: int = 4000
Drive pulse duration [ns]. Same for all qubits.
- drive_amplitude: float = 1.0
Drive pulse amplitude (optional). Same for all qubits.
- nshots: int
Number of executions on hardware.
- relaxation_time: float
Wait time for the qubit to decohere back to the ground state.
How to execute a qubit spectroscopy experiment
A possible runcard to launch a qubit spectroscopy experiment could be the following:
- id: qubit spectroscopy 01
  operation: qubit_spectroscopy
  parameters:
    drive_amplitude: 0.01 # drive power
    drive_duration: 4000 # ns
    freq_width: 20_000_000
    freq_step: 1_000_000
    nshots: 1024
    relaxation_time: 20_000
The report shows the signal magnitude and phase, with a Lorentzian fit performed on the signal magnitude to extract the qubit frequency. The image below shows the fitted magnitude trace:

To extract the qubit frequency, a Lorentzian fit is performed on the signal magnitude.
Requirements
Qubit power spectroscopy
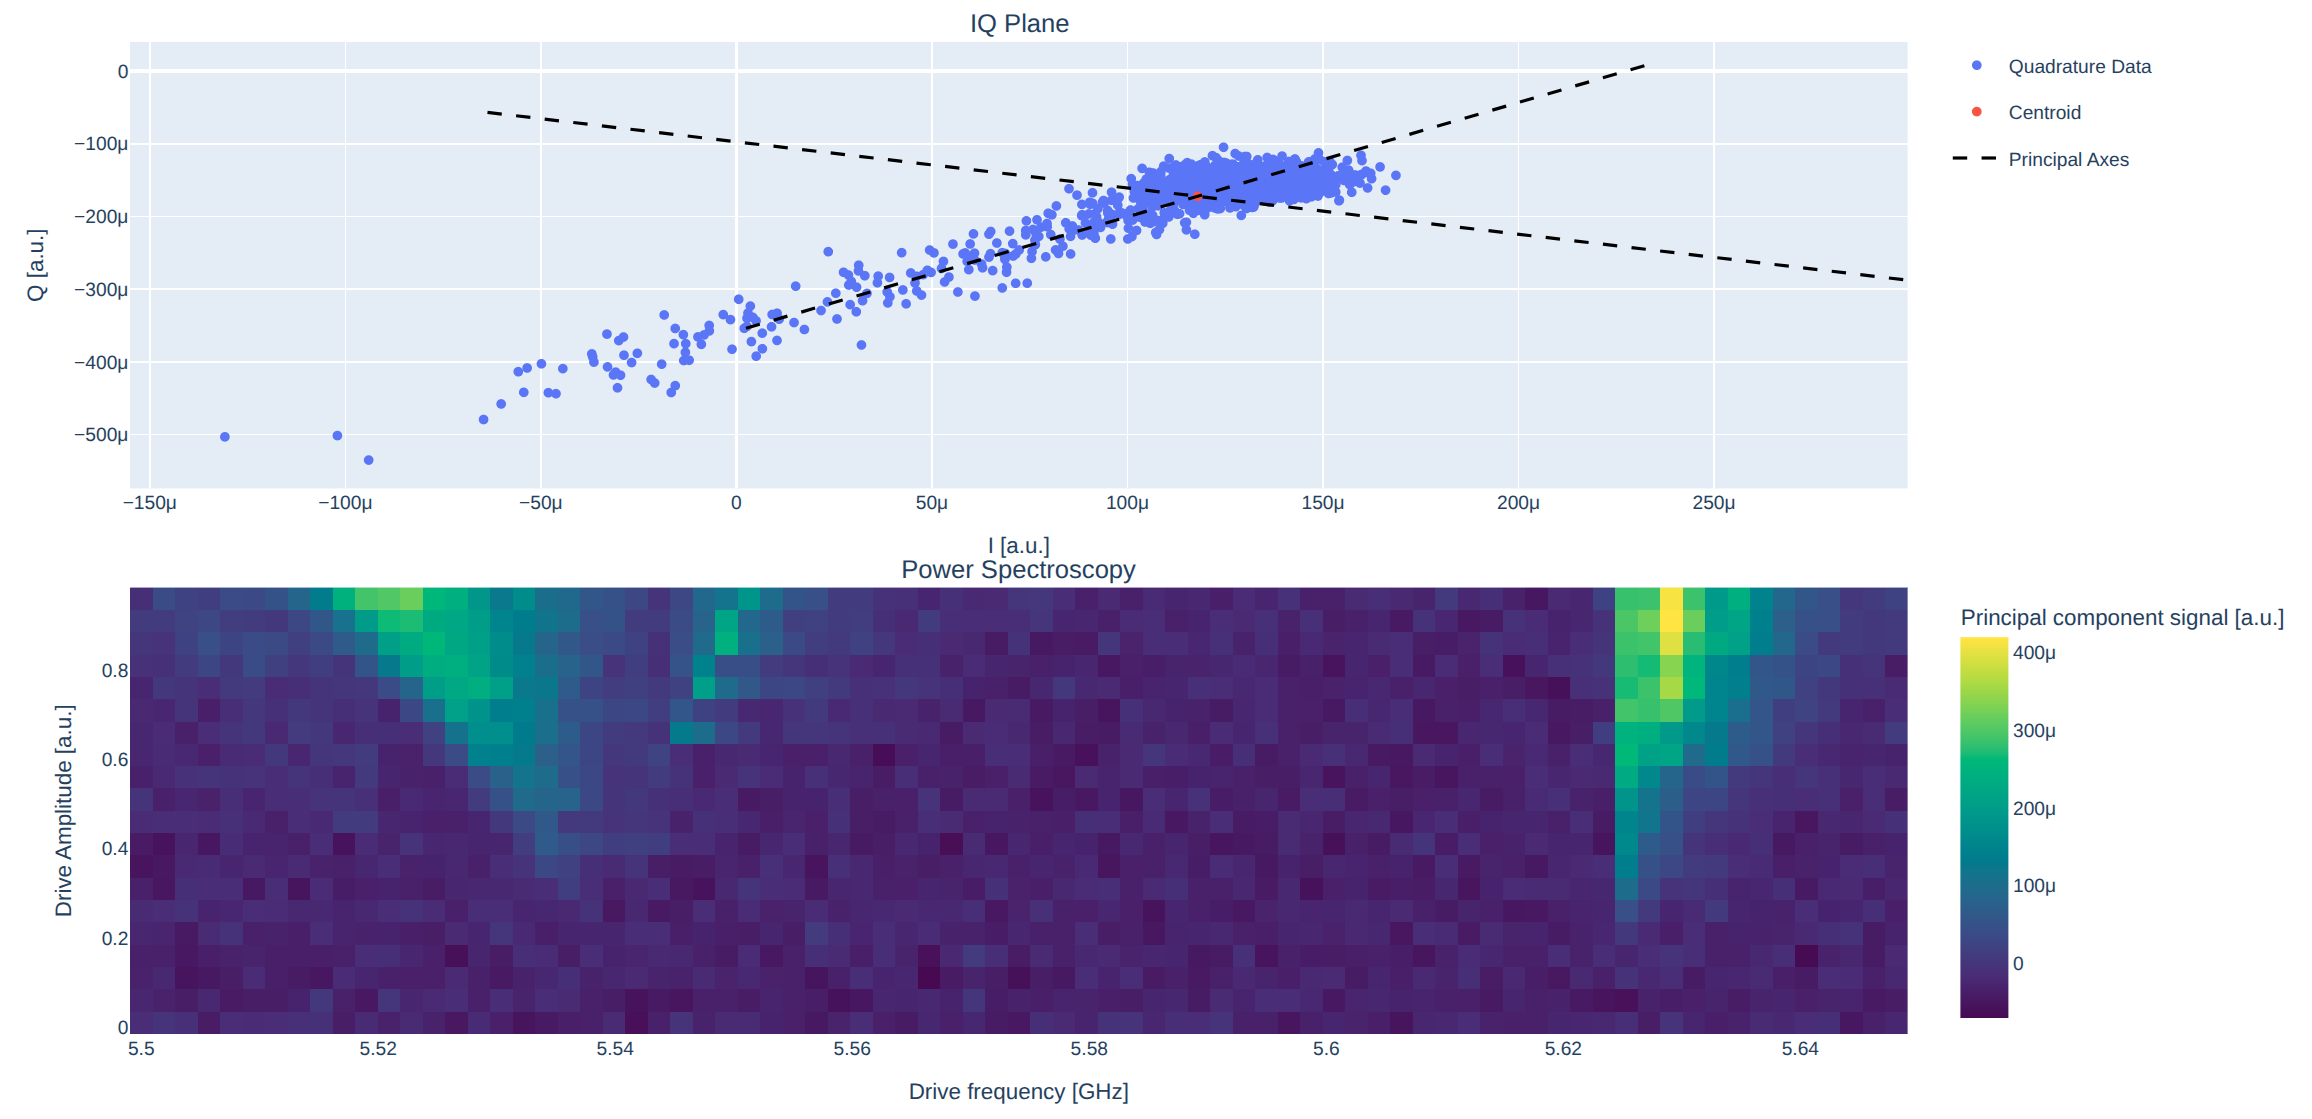
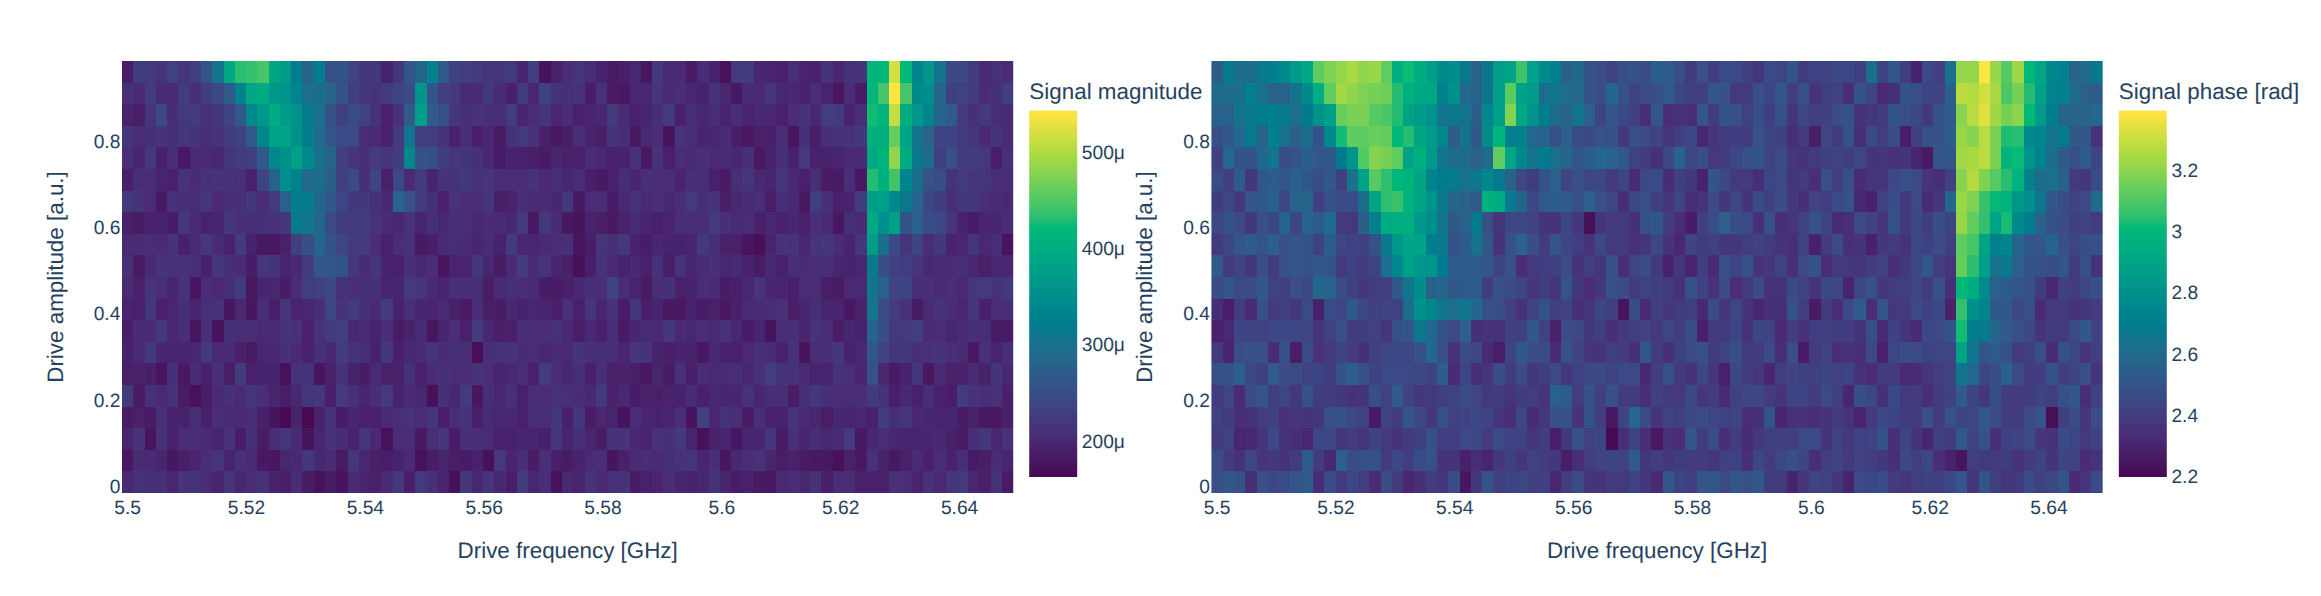
Qubit power spectroscopy sweeps the drive frequency and amplitude to inspect how spectral peaks change with drive power. Increasing the amplitude can make higher-energy transitions visible, and can help distinguish a qubit transition from other spectral features.
The protocol does not perform a fit. The PCA_VARIANCE_THRESHOLD constant,
currently set to 0.85, determines which plot is shown. If the first
principal component explains more than 85% of the total IQ-data variance, the
plot uses that component; otherwise, it shows signal magnitude and phase as
separate heatmaps.
When the explained-variance ratio is above the threshold, the plot also shows the IQ data and principal axes:
At or below the threshold, magnitude and phase are plotted separately:
Parameters
- class qibocal.protocols.qubit_spectroscopies.qubit_power_spectroscopy.QubitPowerSpectroscopyParameters(frequency: tuple[float, float, float] | tuple[Literal['linspace'], float, float, int] | tuple[Literal['window'], float, float, float] | tuple[Literal['linwindow'], float, float, int] | tuple[Literal['center'], float, float] | tuple[Literal['lincenter'], float, int] | tuple[Literal['asym'], tuple[float, float], float] | tuple[Literal['linasym'], tuple[float, float], int] | None = None, freq_width: int | None = None, freq_step: int | None = None, amplitude: tuple[float, float, float] | tuple[Literal['linspace'], float, float, int] | tuple[Literal['window'], float, float, float] | tuple[Literal['linwindow'], float, float, int] | tuple[Literal['center'], float, float] | tuple[Literal['lincenter'], float, int] | tuple[Literal['asym'], tuple[float, float], float] | tuple[Literal['linasym'], tuple[float, float], int] | None = None, min_amp: float | None = None, max_amp: float | None = None, step_amp: float | None = None, duration: int = 4000)[source]
QubitPowerSpectroscopy runcard inputs.
- frequency: tuple[float, float, float] | tuple[Literal['linspace'], float, float, int] | tuple[Literal['window'], float, float, float] | tuple[Literal['linwindow'], float, float, int] | tuple[Literal['center'], float, float] | tuple[Literal['lincenter'], float, int] | tuple[Literal['asym'], tuple[float, float], float] | tuple[Literal['linasym'], tuple[float, float], int] | None = None
Frequencies for the sweep [Hz].
- amplitude: tuple[float, float, float] | tuple[Literal['linspace'], float, float, int] | tuple[Literal['window'], float, float, float] | tuple[Literal['linwindow'], float, float, int] | tuple[Literal['center'], float, float] | tuple[Literal['lincenter'], float, int] | tuple[Literal['asym'], tuple[float, float], float] | tuple[Literal['linasym'], tuple[float, float], int] | None = None
Amplitudes for the sweep [a.u.].
- duration: int = 4000
Drive duration.
- nshots: int
Number of executions on hardware.
- relaxation_time: float
Wait time for the qubit to decohere back to the ground state.
How to execute a qubit power spectroscopy experiment
A possible runcard to launch a qubit power spectroscopy experiment could be the following:
- id: qubit power spectroscopy
  operation: qubit_power_spectroscopy
  parameters:
    freq_width: 20_000_000
    freq_step: 1_000_000
    min_amp: 0.001
    max_amp: 0.05
    step_amp: 0.001
    duration: 4000 # ns
    nshots: 1024
    relaxation_time: 20_000
The frequency range is centered on the configured drive frequency. Alternatively,
the frequency and amplitude parameters can each specify a range directly.
Qubit spectroscopy for higher excited states
Through a qubit spectroscopy experiment it is possible to target also the transition frequencies towards higher energy level other than the first excited state.
To visualize these secondary excitations it is necessary to provide a considerable amount of drive power, which might be outside the limit of the experimental setup.
Another way to address the higher levels is to first excite the qubit to state \(\ket{1}\) followed by the sequence previously presented for the qubit spectroscopy. In this way it is possible to induce a transition between \(\ket{1}\leftrightarrow\ket{2}\).
The protocol applies an \(RX\) pulse to prepare \(\ket{1}\), then sweeps
a spectroscopy tone on the qubit’s 1-to-2 drive channel before readout. By
default, the sweep is centered on the frequency configured for that channel.
Set frequency to provide an explicit sweep range, or use freq_width and
freq_step for a range centered on the configured frequency. As with the
ground-state experiment, drive_duration and drive_amplitude control the
spectroscopy pulse.
Such frequency \(\omega_{12}\) should be below \(\omega_{01}\) by around \(200 - 300\) MHz for flux tunable transmons. From \(\omega_{12}\) and \(\omega_{01}\) it is possible to compute the anharmonicity \(\alpha\) as [15]:
In the literature the energy levels can be expressed as \(\ket{g}, \ket{e}, \ket{f}\), to
address the ground state, the excited state and the first excited state above the excited state.
For this reason the experiments has been labelled qubit_spectroscopy_ef.
Parameters
- class qibocal.protocols.qubit_spectroscopies.qubit_spectroscopy_ef.QubitSpectroscopyEFParameters(frequency: tuple[float, float, float] | tuple[Literal['linspace'], float, float, int] | tuple[Literal['window'], float, float, float] | tuple[Literal['linwindow'], float, float, int] | tuple[Literal['center'], float, float] | tuple[Literal['lincenter'], float, int] | tuple[Literal['asym'], tuple[float, float], float] | tuple[Literal['linasym'], tuple[float, float], int] | None = None, freq_width: int | None = None, freq_step: int | None = None, drive_duration: int = 4000, drive_amplitude: float = 1.0)[source]
QubitSpectroscopyEF runcard inputs.
- drive_amplitude: float = 1.0
Drive pulse amplitude (optional). Same for all qubits.
- drive_duration: int = 4000
Drive pulse duration [ns]. Same for all qubits.
- frequency: tuple[float, float, float] | tuple[Literal['linspace'], float, float, int] | tuple[Literal['window'], float, float, float] | tuple[Literal['linwindow'], float, float, int] | tuple[Literal['center'], float, float] | tuple[Literal['lincenter'], float, int] | tuple[Literal['asym'], tuple[float, float], float] | tuple[Literal['linasym'], tuple[float, float], int] | None = None
Drive frequency [Hz] range for sweep.
- nshots: int
Number of executions on hardware.
- relaxation_time: float
Wait time for the qubit to decohere back to the ground state.
How to execute a qubit spectroscopy EF experiment
A possible runcard to launch a qubit spectroscopy experiment could be the following:
- id: qubit spectroscopy 12
  operation: qubit_spectroscopy_ef
  parameters:
    drive_amplitude: 0.01 # drive power
    drive_duration: 4000 # ns
    freq_width: 20_000_000
    freq_step: 1_000_000
    nshots: 1024
    relaxation_time: 20_000
The report displays the same signal magnitude and phase panels as the standard qubit spectroscopy. A Lorentzian fit to the magnitude trace extracts \(\omega_{12}\), and the report additionally shows the fitted frequency and the resulting anharmonicity.
After fitting, the anharmonicity is calculated as
\(\alpha = \omega_{12} - \omega_{01}\). When updates are enabled, both the
calibrated 1-to-2 transition frequency and the frequency of the RX12 pulse
are updated.